Website redesign SEO results: One year of data
Organic visits up 28.8% and three times more keywords


Most published case studies about a website redesign show only the numbers that went up. This one is different. For the client we describe here, some indicators got worse after the rebuild, and those are the ones that say the most about what the rebuild actually did.
The client is a music label with a catalogue of several hundred thousand products. At the end of 2024 they carried out a full technical rebuild of their website. The new site went live at the turn of the year, so we can compare the whole of 2024 with the whole of 2025 and get a clean picture of the state before the work and after it. The data comes from Matomo, the tool we use for web analytics instead of Google Analytics.
What we changed, and what we did not
The rebuild was technical. We wrote new source code for the site, built a new catalogue search, moved the site to a more powerful server, made the pages load faster and rebuilt the mobile version.
It is worth listing what we did not do. We did not rewrite the content. We did not expand the catalogue. We did not change the offer. There was no new keyword strategy.
For measurement, the second list matters more than the first. When a company rebuilds its technology, publishes a hundred new pages and starts an advertising campaign at the same time, nobody can explain afterwards what actually worked. Here the work was narrow enough that most of the difference between the two years can be attributed to the technical rebuild.
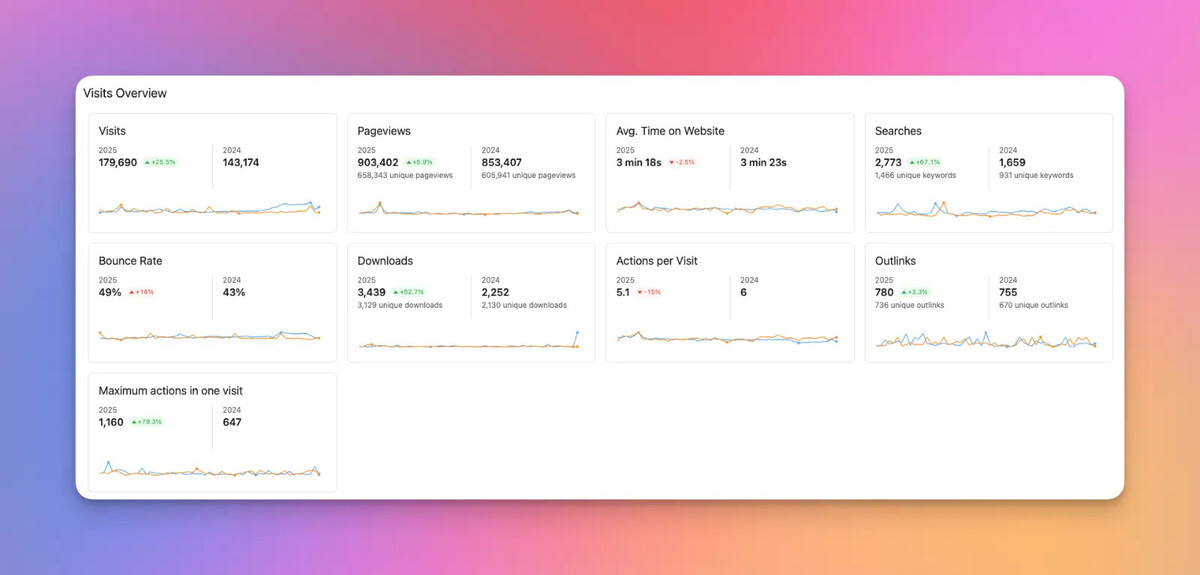
Results for 2024 and 2025
| Indicator | 2024 | 2025 | Change |
|---|---|---|---|
| All visits | 143,174 | 179,69 | +25.5% |
| Visits from search engines | 58,378 | 75,219 | +28.8% |
| Different keywords | 4,2 | 11 | +161.9% |
| Different search engines | 17 | 24 | +41.2% |
| New visitors | 83,83 | 111,362 | +32.8% |
| Returning visitors | 59,344 | 68,328 | +15.1% |
| Page views | 853,407 | 903,402 | +5.9% |
| File downloads | 2,252 | 3,439 | +52.7% |
| Site searches | 1,659 | 2,773 | +67.1% |
| Bounce rate | 43% | 49% | worse |
| Actions per visit | 6 | 5.Jan | worse |
| Average time on page | 03:23 | 03:18 | worse |
The last three rows are the reason this case study is worth reading
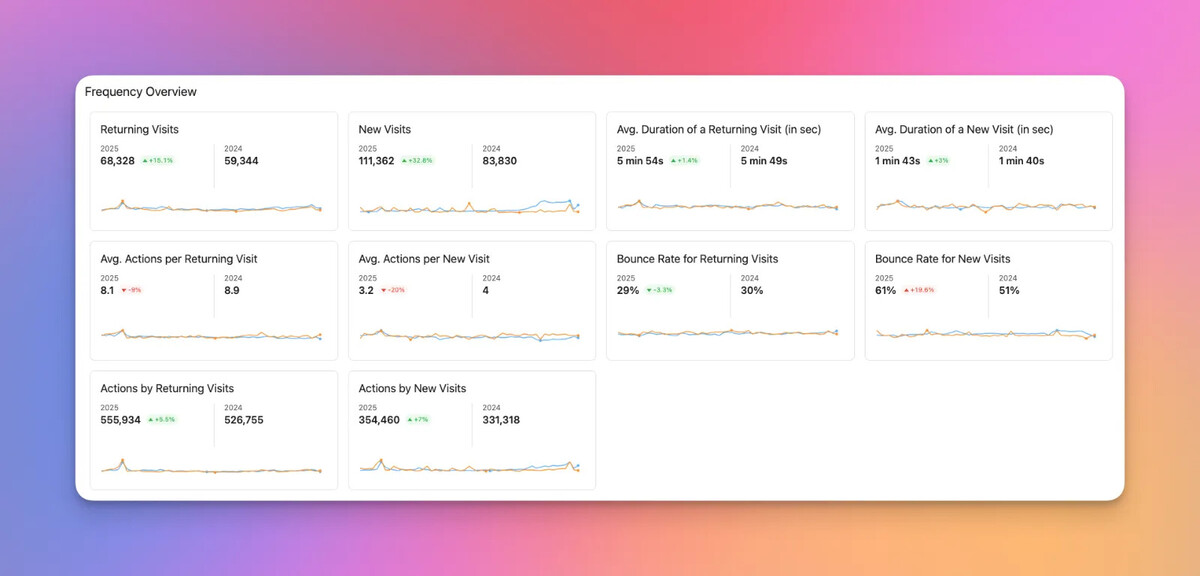
The most important number is not traffic
Traffic growth of 25.5% looks good, and it is the weakest piece of evidence in the whole table. For a music label, traffic depends heavily on what its artists released that year and on what radio stations played. If we gave you only that number, you would be right to doubt it.
The wider keyword range is more convincing. In 2024 the site appeared in search results for 4,200 different keywords. In 2025 it appeared for 11,000. The number of search engines sending visitors to the site rose from 17 to 24.
Consider what that means. The content did not change in any meaningful way. Same catalogue, same subpages, same descriptions. What changed was the ability of search engines to read that content, understand it and rank it. New code meant a cleaner page structure. A faster server meant that crawlers got through more pages in the same time. A better mobile version meant a better starting position for indexing, which at Google has been mobile first for years.
The content was there all along. Search engines simply could not reach it.
That is hard to explain with the popularity of the artists. A label with a hit record gets more traffic. It does not triple its keyword range. This is the part of the work that technical SEO is responsible for.
One more figure is worth noting. The average number of visits per keyword fell from 13.9 to 6.8. The site no longer lives off a handful of queries. It now covers a much wider range of keywords and search intents. That figure explains the next section.
Why the bounce rate rose, and why that was not a failure
The bounce rate got worse, from 43% to 49%. If we stopped at that number, the conclusion would be clear. The rebuild made the user experience worse.
The conclusion would be wrong.
Split the data into new and returning visitors and this is what appears. For returning visitors the bounce rate fell from 30% to 29%. For new visitors it rose from 51% to 61%. At the same time, the share of new visitors in total traffic rose from 58.6% to 62.0%.
Time on page tells the story even more clearly. The overall average fell from 3:23 to 3:18. For returning visitors it rose from 5:49 to 5:54, and for new visitors from 1:40 to 1:43. Both groups improved. The overall average still got worse.
This is not a measurement error. New visitors stay about three times less time than returning visitors, which is entirely normal. When their share grows, they pull the overall average down, even when nothing has got worse. We checked it with a calculation. Take the average for each group, weight it by that group's share of traffic, and you get exactly the overall figures that Matomo reports.
The practical lesson is simple. After a rebuild that brings in a lot of new visitors, overall averages almost always get worse. Before you raise the alarm, split the data by group. Anyone who skips that step will declare a successful rebuild a failure.
One question remains. Why did the bounce rate for new visitors really get worse, from 51% to 61%? The shift in the structure of traffic does not explain that. The figure from the previous section does. The site now ranks for 11,000 keywords instead of 4,200, which means far more informational queries. Someone looking for the release year of an album arrives, finds the answer and leaves. For analytics that is a bounce. For the visitor it is a search that ended well. Analytics results always need to be read in a wider context, and it helps to know the difference between metrics that look good and metrics that tell you something.
What did get worse
Because this is a case study, it is fair to list what the structure of traffic cannot explain.
Actions per visit fell in both groups. For returning visitors from 8.9 to 8.1, and for new visitors from 4.0 to 3.2. The total number of actions still rose by 6.1%, from 858,073 to 910,394. There is more engagement overall, spread across more visits.
Our explanation is the rebuilt product search, and we present it as an assumption, not as a proven fact. The site search data supports it. Searches on the site rose by 67.1%, and the number of different search terms rose from 9,310 to 14,600. Visitors use the search far more, which means they reach the page they want in fewer steps. Fewer clicks to the goal is good for the user and looks bad in analytics.
Speed as real users experience it
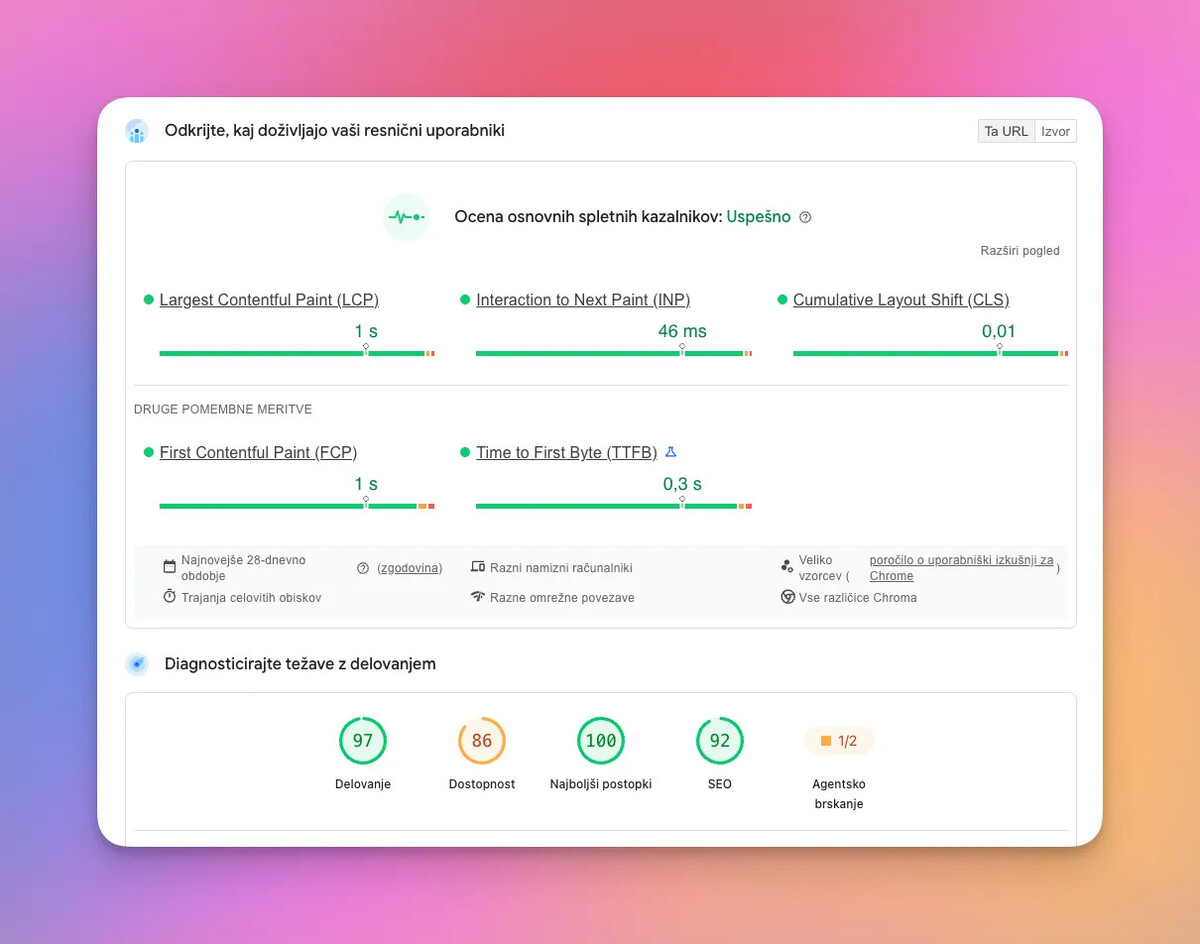
A PageSpeed Insights measurement from August 2026 shows that the site passes the Core Web Vitals assessment on desktop and on mobile. Largest Contentful Paint (LCP) takes one second, server response time (TTFB) is 0.3 seconds, and Cumulative Layout Shift (CLS) is 0.01 on desktop and 0 on mobile.
Server response time is the most direct evidence of the move to a more powerful server. This is where the choice of web hosting shows up in the numbers. We take the view that every serious company should have a dedicated server unit for its website.
Social media: more posts, less traffic
The last figure is the uncomfortable one. In 2025 the client posted on social media more often than in the year before. In the same period, traffic from social media fell by 61.5%, from 15,742 visits to 6,065. The number of social networks sending traffic fell from eleven to eight.
More effort, less result. The reason is not the client. Social networks show external links less and less, and posts that contain a link reach far fewer people.
In the same year, traffic from search engines rose by 28.8% and direct traffic by 43.3%. Investment in the company's own website paid off. Investment in other people's platforms did not. This is exactly why we treat the website as the only marketing channel a company really controls.
What this means for your company
If your site is slow, if the mobile version is out of date and if the source code does not support current technologies, you will need to consider redesigning your website. Content that search engines cannot reach does not exist for them.
A rebuild is not always the answer. When it is necessary, you also need to agree a set of metrics that will tell you whether it worked. That is why the process we follow when we build or rebuild a website always includes setting up measurement before the work starts, not after it.
A rebuild can also be done without losing your existing rankings, which is a common and reasonable concern.
A note on method
We compare the calendar year 2025 with the calendar year 2024. The new site went live at the end of 2024, so the first period matches the state before the work and the second the state after it. The data source is Matomo. The speed measurement comes from PageSpeed Insights on 21 August 2026.
We do not attribute the 43.3% growth in direct traffic to the rebuild. Direct traffic usually comes from brand recognition, and for a music label from how much attention its artists get.
Conversion measurement for this period will be covered in a future article.
Maybe you are interested
Read more